Chordonomicon: Predicting Chords From Graph Representations
April 23, 2026 · Luciano Muratore
Chordonomicon: Predicting Chords From Graph Representations
Before MozartAI entered our lives, I wanted to build a Chord Predictor. The first challenge was finding a large enough dataset to train a model on. That search led to Chordonomicon: a dataset of 666,000 songs and their respective chord progressions. What made it immediately interesting was not its size—it was the way the data was structured.
The chord progressions are stored as graphs.
Chord Progressions as Graphs
In the graph representation, each node is a chord, and each directed edge is a transition—a chord that follows another chord in the song. The edge weights represent probabilities: how often chord B follows chord A across all the occurrences in that song.
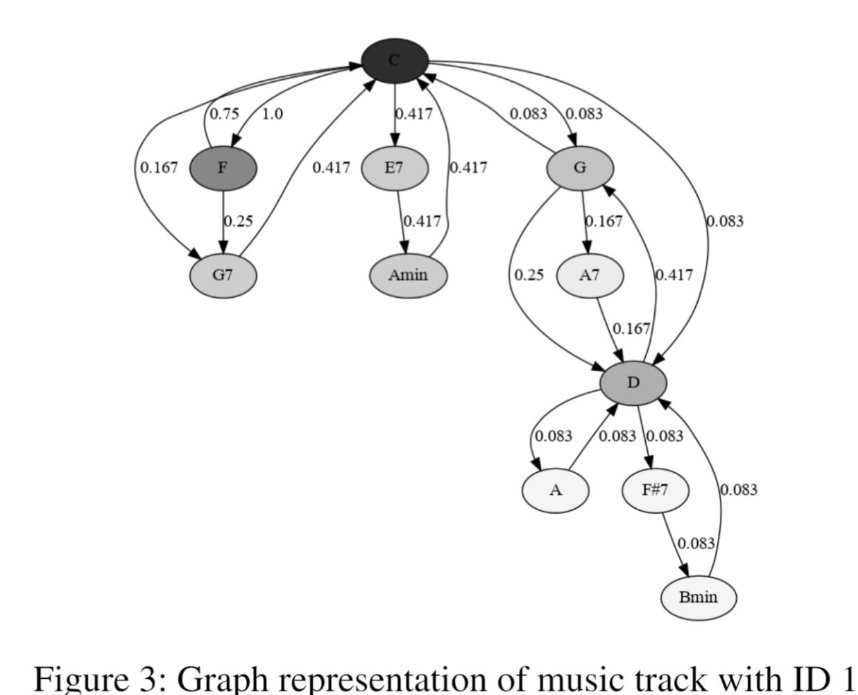
Looking at Figure 3 for Song ID 1, the structure is immediately readable:
- C is the central node. It has directed edges to F, E7, G, and D, with varying probabilities. It is also the destination of several return edges. It is clearly the most connected chord in the graph.
- G and D are secondary hubs, each connecting to several chords below them.
- F#7, Bmin, and Amin are leaves—they appear but do not transition to many other chords.
The edge weights encode frequency. A weight of 1.0 on F → C means that every time F appears, it resolves to C. A weight of 0.083 on D → Bmin means that transition is rare.
How Chord Prediction Works
Given this graph, predicting the next chord is essentially a weighted graph traversal. If the current chord is G, the model looks at the outgoing edges from G, considers their probabilities, and samples or picks the most likely successor.
At its simplest, this is a Markov chain: the next chord depends only on the current one, and the transition probabilities are read directly from the graph. Trained across 666,000 songs, the model learns which transitions are common across musical styles and which are idiomatic to specific genres or keys.
More sophisticated approaches—such as graph neural networks or sequence models that look back further than one step—can use the full graph structure to capture longer harmonic context. But even the simplest Markov formulation produces musically coherent progressions, because the graph itself already encodes real musical behavior.
Can the Graph Reveal the Key?
This is a question that has been on my mind since seeing this representation. My knowledge of music theory is limited, but the intuition seems sound: the chord with the most connections—the highest degree node—is likely the tonic, and the tonic defines the key.
In Song ID 1, C is the most connected node. The key of C major contains exactly the chords visible in the graph: F, G, Am, E7 (as a secondary dominant), D (as a borrowed chord), G7, A7, and others. The graph’s topology is not random—it reflects the gravitational pull of the tonic.
This suggests a simple heuristic: rank the nodes by their weighted in-degree (the total probability of transitions arriving at them). Nodes that many other chords resolve to are more likely to be key centers. The highest-ranked candidate is the predicted key.
Whether this holds generally—across different genres, modal music, or songs that deliberately avoid a clear tonic—is an open empirical question. But for the common-practice tonal music that dominates a dataset of 666,000 songs, it seems like a reasonable starting point.
Why the Graph Representation Matters
Storing chord progressions as graphs rather than plain sequences carries several advantages for a machine learning model:
- Transition probabilities are explicit. There is no need to compute them from raw sequences at training time—they are already encoded in the edge weights.
- The structure is reusable. Once a graph is built for a song, it can be queried for any chord prediction task without re-reading the full sequence.
- Graph-native models apply directly. Graph neural networks, random walks, and PageRank-style centrality measures all operate naturally on this representation.
The Chordonomicon paper formalizes this and provides both the dataset and baseline models. The dataset is also available on Hugging Face for direct use.
Summary
- Chordonomicon is a dataset of 666,000 songs with chord progressions stored as weighted directed graphs.
- Each node is a chord; each directed edge is a transition with a probability weight.
- Chord prediction is a weighted graph traversal—at its simplest, a Markov chain over transition probabilities.
- The most connected node in the graph is likely the tonic chord, which means the graph topology may be enough to infer the key of a song.
- Graph representations make transition probabilities explicit and enable graph-native machine learning models.
- Final Insight: Music theory and graph theory describe the same thing from different angles. Chordonomicon just makes that relationship computable.
Paper: https://lnkd.in/eqQmJy3k
Dataset on Hugging Face: https://lnkd.in/eRab2X4d